
Our faculty members are engaged in cutting-edge research across areas in actuarial science, statistics, and data science, contributing to advancements in diverse fields such as finance, health care, and technology.
Our collaborative research environments allow students the opportunity to work alongside our esteemed faculty on meaningful projects that address complex challenges.
Our department is nationally visible in the following areas:
- Categorical data
- Computer intensive statistics
- Forensic statistics
- High-dimensional data analysis
- Insurance/financial mathematics
- Order restricted inference
- Semiparametric inference
- Spatial statistics
- Statistical analysis of genomic data
- Statistical computing
- Survival analysis
- Time series
Research resources
Actuarial science journals
Statistics journals
Research services
Research highlights
March Madness by Dale Zimmerman
The National Collegiate Athletic Association Division I Men's Basketball Tournament, a.k.a. "March Madness," is one of the most popular sporting events in the United States. Sports statisticians have been attracted to various aspects of March Madness, including methods for selecting and seeding teams and for predicting game outcomes.
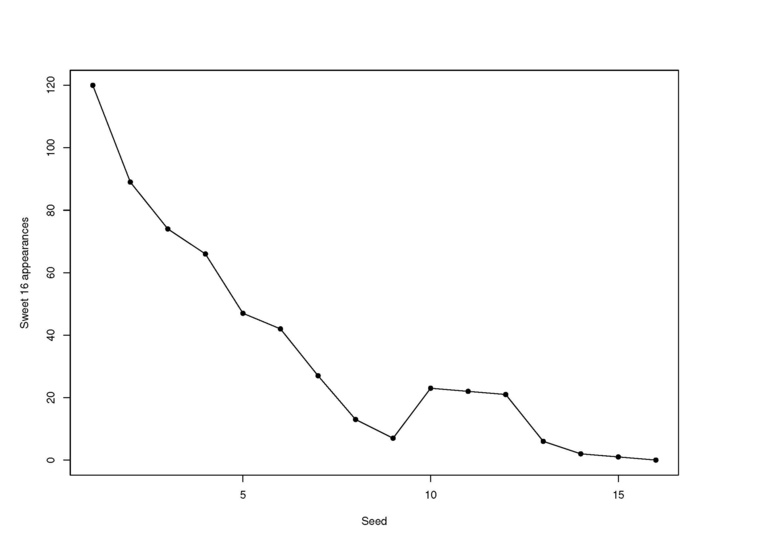
Recently, I have been conducting research on an aspect of March Madness that has attained a certain level of notoriety in the popular press but has received relatively less attention from statisticians: its perceived anomalies. One of these is the "12-5 upset anomaly" wherein it has been claimed that 12-seeds upset 5-seeds in their first-round matchups significantly more often than expected. In "March Madness Anomalies: Are They Real and If So, Can They Be Explained?" published in the May 2021 issue of The American Statistician, I use standard binomial methods and logistic regression to debunk this claimed "anomaly," but I find strong statistical evidence, using methodology for order-restricted inference on multinomial probabilities, for another, "middle-seed anomaly" in which each of seeds 10, 11, and 12 have, over the history of March Madness, made it to the Sweet 16 much more often than seeds 8 and 9.
The accompanying figure displays the middle-seed anomaly graphically. In a follow-up article "The Middle-Seed Anomaly: Why Does It Occur in Some Sports Tournaments But Not Others?" published in the August 2021 issue of Journal of Quantitative Analysis in Sports, I show that a middle-seed anomaly also occurs in the women's counterpart to March Madness, but not in any of several other major sports tournaments that are similar in structure (the NBA Playoffs and the Stanley Cup, among others). I offer explanations for the presence of a middle-seed anomaly in the college basketball tournaments and its absence in the others that are based on the combined effects of the functional form of the relationship between team strength (as estimated by an interesting linear model) and seed, the degree of parity among participating teams, and certain elements of tournament structure (e.g., the size of the brackets and the presence or absence of a home-court advantage).
High-dimensional models and microarray data analysis by Jian Huang
Over the past decade DNA microarray technology has attracted tremendous interest in basic science labs, clinical labs and in industry. Microarrays are capable of monitoring the expression of thousands of genes simultaneously and have many important applications in biological and biomedical research. They are used, for example, to characterize disease states, determine the effects of certain treatments, and to examine the process of development. Microarrays are also increasingly used for identifying genes and genomic regions that increase the risk of common and complex diseases such as diabetes, heart diseases, and autism.
While microarrays have become a routine tool in research, analysis of microarray data is challenging. A hallmark of microarray data is high-dimensionality, since a typical microarray study surveys at least thousands of genes, but the sample size is often at most in the hundreds. This is called a "large p, small n" problem in statistics, where p refers to the number of variables (genes), and n refers to the sample size (the number of subjects participating in the study). Standard methods are not applicable to such problem since they require that p is smaller than n. Two other important features of microarray data are sparsity and the presence of cluster structure. Sparsity is due to the fact that the number of genes important to a trait or disease is usually small. The task of finding such genes for a given trait can be formulated as a variable selection problem in statistical modeling. Cluster structure is present since genes in the same biological pathways or functional groups tend to be correlated. Incorporation of such information in statistical modeling facilitates the identification of statistically and biologically significant patterns from data.
I have been working on approaches for correlating microarray data with a clinical outcome. These methods take into account the features described above. The focus is on developing variable selection methods for the identification of genes and pathways that are associated with disease such as age related macular degeneration or a disease related quantitative trait such as the survival time of lymphoma patients.
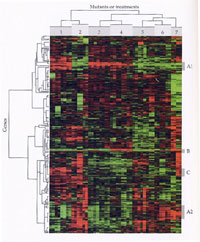
The featured image (from "A Primer of Genome Science" by Greg Gibson and Spencer Muse, Sinauer Associates, 2002) is part of a cDNA microarray. Each pixel in the image represents part of the DNA sequence of a gene. Red pixels indicates genes with relatively higher expression in the treatment sample than in the mutant sample. The dendrogram on left side indicates that genes tend to be clustered according to their expression across the samples, the one on the top suggests that samples can also be clustered using gene expression.
MRI tissue classification of the human brain by Dai Feng and Luke Tierney
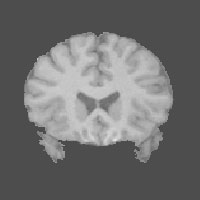
Magnetic resonance imaging (MRI) is an important non-invasive tool for understanding the structure and function of the human brain. One important task is to use MR images to identify the major tissue, white matter (WM), gray matter (GM), and cerebro-spinal fluid (CSF), within a particular subject's brain. This is valuable, for example in detecting diseases, in preparation for surgery, and to aid in subsequent functional studies of the brain.
An MR image is based on a discretization of the viewing area into a 3-dimensional array of volume elements, or voxels. Typical images consist of a 256 x 256 x 256 array of one cubic millimeter voxels. Segmentation is usually based on a T1-weighted image providing one measurement for each voxel. The measurements contain some noise that is usually modeled as normally distributed and independent from voxel to voxel. A simple model views each voxel as homogeneous, belonging entirely to one of the three major tissue types; the measurements are thus normally distributed with means depending on the tissue types of their voxels. The tissue types are not known and need to be identified from the image. Since nearby volumes tend to be of the same tissue type, a Markov random field model can be used to capture the spatial similarity of voxels. A Markov chain Monte Carlo approach can be used to fit this model.
A more realistic model than the one just described would take into account the fact that the volume elements are not homogeneous; while some may contain only one tissue type, others on the interface will contain two or possibly three different tissue types. Our approach to this problem is to construct a higher resolution image in which each voxel is divided into 8 subvoxels. For each voxel the measured value is the sum of the unobserved measurements for the subvoxels. The subvoxels are in turn assumed to be homogeneous and follow the simpler model described above. This approach provides more accurate tissue classification and also allows more effective estimation of the proportion of each voxel that belongs to each of the major tissue types.

Research and creative production in the College of Liberal Arts and Sciences
As part of a top-tier, AAU-accredited public research university, the College of Liberal Arts and Sciences holds scholarly, scientific, and artistic discovery at the heart of our mission.
Throughout our departments and programs, our professors are at the forefront of their disciplines. They bring their world-class research and artistry into their classrooms, studios, and labs, giving students the unparalleled opportunity to learn right from the source of the latest innovations in knowledge and practice.
Graduate students and many undergraduates work side-by-side with faculty members, conducting breakthrough research and creative production that advances humanity’s understanding of ourselves and the complex, ever-changing world in which we live.
The creation of knowledge and understanding is an exhilarating and never-ending mission—and is at the core of every University of Iowa liberal arts and sciences education.